Introduction
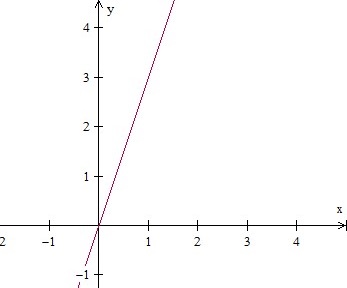
We graph a line whose equation is given, say for example y = 3x. We need at least two points or ordered pairs to graph the line. First we choose some x values. Then we evaluate y = 3x for each value of x.
For example for x = 0, y = 30 = 0; x = 1, y = 31 = 3 and so on. We put the x, y and the ordered pair x,y values as follows.
| x | y | x,y |
|---|---|---|
| 0 | 30 = 0 | 0,0 |
| 1 | 31 = 3 | 1,3 |
| 2 | 32 = 6 | 2,6 |
| 3 | 33 = 9 | 3,9 |
| 4 | 34 = 12 | 4,12 |
We see that the ordered pairs lie in the quadrant 1. Joining the points will give the graph of the line in quadrant 1.
Example 1
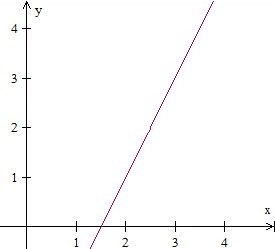
Graph the line in the quadrant 1, whose equation is given below.
2x y = 3
Solution
Step 1:
Given equation 2x y = 3; for y = 0, x = 3/2; for x = 2, y = 223 = 43 = 1. So two ordered pairs are 3/2,0 2,1
Step 2:
Plotting the points and joining with a line we get
Example 2
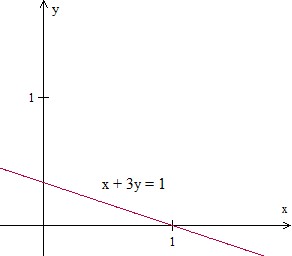
Graph the line in the quadrant 1, whose equation is given below.
x + 3y = 1
Solution
Step 1:
Given equation x + 3y = 1; for y = 0, x = 1; For x = 0, y = 1/3. So two ordered pairs are 1,0 and 0,1/3
Step 2:
Plotting the points and joining with a line we get
Print Page
Leave a Reply