The strength of molecular interactions is determined by the mean intermolecular distance and the property that most directly reflects this distance is molar density, or its reciprocal, molar volume. The approximate relationship between molar volume and mean intermolecular distance is given by (see Example 1.1),
where NA is Avogadro’s number. The packing density of molecules in given volume reflects the strength of the potential interaction. In gases (large V), distances are large and interactions weak. In liquids, the opposite is true. The volume that is occupied by a fixed number of molecules depends both on temperature and pressure. The relationship between volume, pressure, and temperature is of fundamental importance and its mathematical form is known as equation of state. In this chapter we examine this relationship in graphical and mathematical form. The learning objectives of this chapter are to develop the following skills:
1. Using the PVT graph to identify the phase of a pure fluid.
2. Working with tabulated values of P, V, T (steam tables).
3. Identify the region of applicability of the ideal-gas law and the truncated virial equation.
4. Working with cubic equations of state.
5. Working with generalized correlations for the compressibility factor.
6. Representing processes on the PV graph.
2.1 The PVT Behavior of Pure Fluid
The molar volume, V, is the volume occupied by 1 mol of the substance, and is the inverse of the molar density, ρ:1
1. We will use the same general symbol, ρ, for both the molar density and the mass density. We will annotate them differently only if they both appear in the same equation.
The specific volume is the volume occupied by 1 kg of substance. The specific volume, the mass density, and the molar densities are related to each other:

where ρ′ is the mass density (kg/m3) and Mm is molar mass (kg/mol). The volume occupied by a given amount of matter depends on temperature and pressure: it decreases under compression and (for most substances) increases upon heating. The relationship between P, V, T is characteristic of a substance but the general features of this relationship are common to all pure fluids and will be examined below.
The relationship between volume, pressure, and temperature is represented graphically by a three-dimensional surface whose general shape is shown in Figure 2-1. This graph has been rotated to show pressure in the vertical axis, with the mesh lines on the surface representing lines of constant temperature (left to right), and lines of constant volume (front to back). A point on the surface gives the molar volume at the indicated pressure and temperature. The bell-shaped curve facing the pressure-volume plane is the vapor liquid boundary. To its left is the liquid region (steep part of the surface), to its right the vapor region. At sufficiently low temperatures a system exhibits a phase transition to a solid; this region is not shown on this graph.2
2. The surface in Figure 2-1 was calculated using the Soave-Redlich-Kwong equation of state (see Section 2.6), which is appropriate for liquids and gases but not for solids.
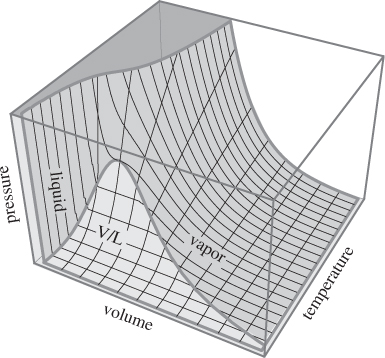
Figure 2-1: The PVT surface of a pure fluid.
The three-dimensional representation is useful for the purposes of visualizing the PVT relationship but is impractical for routine use. We work, instead, with projections of the PVT surface on one of the three planes, PV, PT, or VT. A projection is a view of the three-dimensional surface from an angle perpendicular to the projection plane and reduces the graph into a two-dimensional plot. The most commonly used projections are those on the PV and the PT planes.
The PV Graph
The PV graph is the projection on the PV plane and is shown in Figure 2-2. The characteristic feature of this graph is the vapor-liquid region, represented by a bell-shaped curve that consists of two branches, saturated liquid (to the left) and saturated vapor (to the right). The two branches meet at the top and this point defines the critical point of the fluid. Temperature is indicated by contours of constant temperature (isotherms). These are lines with the general direction from the upper left corner to the lower right. The isotherm that passes through the critical point corresponds to the critical temperature, TC. This isotherm has an inflection point at the critical point, namely, its first and second derivatives are both zero:

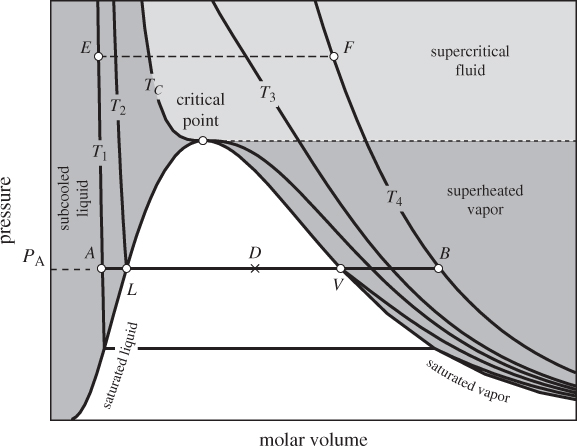
Figure 2-2: The PV graph of pure fluid (the solid phase is not shown).
From there on, it decreases smoothly into the vapor region. The region to the left of the saturated liquid is called subcooled liquid to indicate that its temperature is below the boiling point that corresponds to its pressure. For example, at A the temperature is T1, lower than the saturation temperature (T2) that corresponds to pressure PA. Alternatively, it is called compressed liquid to indicate that pressure is higher than the saturation pressure that corresponds to its temperature (the terms subcooled and compressed liquid are used interchangeably). Vapor to the right of the saturated line is superheated because its temperature is higher than the boiling temperature that corresponds to its pressure. At B, for example, temperature (T4) is higher than the saturation temperature (T2) that corresponds to its pressure.
The organization of information on the PV graph can be better understood by conducting a heating or cooling process and following the path on the graph. Suppose we add heat under constant pressure starting with liquid at state A, which is at pressure PA and temperature TA = T1. The process is depicted by the line AB, drawn at constant pressure PA. Between states A and L, heating causes the volume to increase somewhat but the increase is relatively small because the thermal expansion of liquids is small. At point L the liquid is saturated and at the verge of boiling. Adding heat at this point causes liquid to evaporate and produce more vapor, moving the state along the line LV. During this process both pressure and temperature remain constant (line LV is both an isotherm and an isobar). At point V all the liquid has evaporated and the system is saturated vapor. Adding more heat causes temperature and molar volume to increase and moves the state along the line VB. If we start at state B and perform a constant-pressure cooling process, we will observe the reverse course of events. During BV, the vapor is cool. At point V, the state is saturated vapor at the verge of condensation. Removing heat at this point causes vapor to condense until the steam becomes 100% saturated liquid (state L). Upon further cooling, the system moves further into the subcooled region.
Note
Boiling in Open Air
If the heating/cooling process that is described here is conducted in an open container, for example, by heating water in an open flask at atmospheric pressure, the behavior will be somewhat different than the one described here. In an open container, water forms vapor at any temperature below boiling, not just at the boiling point. The important difference is that in an open container we are dealing with a multicomponent system that contains not only water, but also air. A vapor-liquid mixture with two or more components behaves differently from the pure components. Multicomponent phase equilibrium is treated in the second part of this book and until then, it should be understood that we are dealing with pure fluids. The process described by the path AB may be thought to take place inside a sealed cylinder fitted with a piston and initially filled with liquid containing no air at all.
The Critical Point
The critical point is an important state and its pressure and temperature have been tabulated for a large number of pure substances. In approaching the critical point from below, the distance between points L and V decreases, indicating that the molar volume of the saturated liquid and saturated vapor come closer together. At the critical point the two saturated phases coincide: vapor and liquid become indistinguishable and the phase boundary seizes to exist. The region of the phase diagram above Pc and Tc is referred to as supercritical fluid. No isotherms or isobars in this region intersect the vapor-liquid boundary. If point E is heated isobarically to final state F, one will observe a continuous transition from a dense, liquid-like state, to a dilute, gaslike state. In the supercritical region the notions of “liquid” and “vapor” are not helpful. These terms are meaningful when both phases can exist simultaneously and can be identified as distinct from each other. The term supercritical fluid avoids these ambiguities.
Properties near the critical point are quite different compared to states at lower temperatures and pressures. As the difference between vapor and liquid becomes less clear near the critical point, the liquid becomes substantially more compressible than typical liquids. This is indicated on the PV graph by the gentle slope of the isotherm as it approaches the critical point. Isotherms below but near the critical temperature (not shown in Figure 2-2) show similar behavior. The usual approximation that treats liquids as incompressible is acceptable only at temperatures well below the critical. In the supercritical region, the behavior of a fluid is somewhere between that of a liquid and a gas. The gentle slope of the isotherms indicates that the fluid is quite compressible, even at high, liquidlike densities (low molar volumes). Other properties, in particular, the solubility of various nonvolatile solutes, are often found to be quite enhanced compared to the subcritical region. As an example, the enhanced solubility of caffeine in supercritical carbon dioxide (Tc = 304.1 K, Pc = 73.8 bar) makes it possible to use carbon dioxide as a solvent to extract caffeine from coffee, thus avoiding the use of other solvents with potential toxic effects.
A Special Limit: The Ideal-Gas State
If the molar volume is increased sufficiently, the effect of molecular interactions decreases, and in the limit that it becomes infinite, it vanishes completely. When this condition is met we say that the system is in the ideal-gas state. The mathematical specification of the ideal-gas state is :

or, equivalently,

The stipulation of constant temperature is necessary. Without it, it would be possible to maintain the system in the liquid (or even solid) phase, even at very low pressures, thus never reaching a state where intermolecular distances are large. On the PV graph, the ideal-gas state is found near the lower-right corner.
In the ideal-gas state, the PVT relationship is universal for all gases, regardless of chemical composition and this relationship is given by the ideal-gas law:

where Vig is molar volume, T is absolute temperature, and R is a universal constant (ideal-gas constant), whose value in the SI system is

The superscript “ig” will be used to indicate results that are valid only in the ideal-gas state. The ideal-gas law should be viewed as the limiting form of the equation of state of any real fluid when pressure is reduced under constant temperature. Even though the ideal-gas state represents an idealization (infinite distance between molecules), in practice eq. (2.6) provides satisfactory results if the actual state of a gas is sufficiently close to the ideal-gas state. More often than not, engineering problems require calculations at conditions where the ideal-gas law is not valid. It is important to be aware of the limitations of the ideal-gas law and never use it without proper justification.
Leave a Reply