Introduction
In this lesson we understand the mean of a dataset using graphical method.
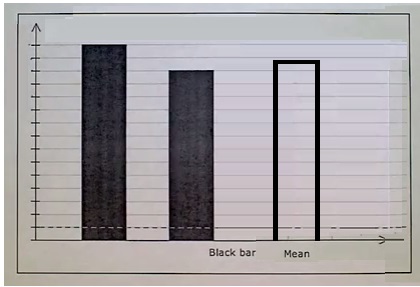
Suppose we are given a bar graph showing two bars of data. Here we are required to find the mean of given data graphically.
Rules to find the mean graphically
- In the bar graph we find the heights of the two bars.
- The average or mean of these heights is found.
- We then draw a third bar with the average height found in second step.
- The height of this third bar gives the mean or average of given data set graphically.
Example 1
The two bars in a bar graph have heights 16 and 22. What height a new bar should have so that it has the mean height of the two bars?
Solution
Step 1:
Heights of given bars 16, 22
Step 2:
Mean height = (16+22)2=382 = 19
So height of new bar = 19
Example 2
The two bars in a bar graph have heights 15 and 27. What height a new bar should have so that it has the mean height of the two bars?
Solution
Step 1:
Heights of given bars 15, 27
Step 2:
Mean height = (15+27)2=422 = 21
So height of new bar = 21
Leave a Reply