Definition
Unit rate is defined as a ratio in which denominator is 1. In general, a unit rate is the number of dependent variables per one independent variable.
For example − A monkey eats 8 bananas in 2 minutes
The unit rate here is the number of bananas the monkey eats in a minute.
Unit rate = 8/2 = 4 bananas per minute.
Unit rate and table
If we have a proportional relationship like for example 9for3kg,wecanmakeatableofvaluesandgraphtherelationship.Wealreadyhavelearntaboutunitrate.Inthiscasetheunitrateisthenumberofdollarsper1kg.Heretheunitrateisfoundas9/3kg = $3/kg.
In a table or graph, representing proportional relationships, the constant of proportionality and the unit rate are same.
Given a unit rate we can write pairs of x and y values following the proportional relationship as follows. For example if the unit rate is 3/kgwecanwrite(1kg,3), 2kg,$6, 3kg,$9, 4kg,$12, 5kg,$15 and so on. We then put these ordered pairs in a table as follows.
| Weight in kgx | Cost in $(y) |
|---|---|
| 1 | 3 |
| 2 | 6 |
| 3 | 9 |
| 4 | 12 |
| 5 | 15 |
Unit rate and graph
The proportional relationship for given rate $3/kg can be written as an equation y = 3x. The same can be plotted as a graph given below.
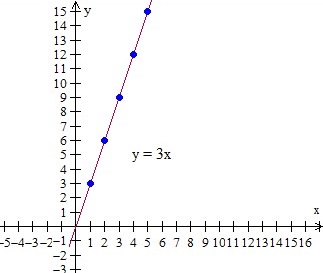
Given a unit rate, we can write a function rule like y = mx, where m is the unit rate, x and y are the variables. Using this rule we can find points with x and y values which can be put in a table. Then we plot these points on a graph.
Example 1
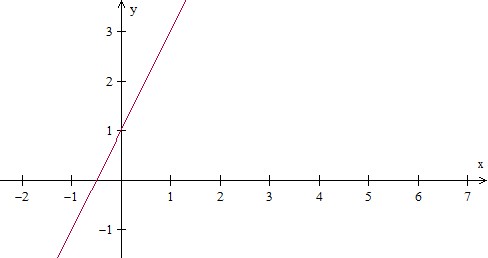
The relationship having unit rate is given by the equation: y = 2x + 1 Make a table and plot 5 points.
Solution
Step 1:
In the equation y = 2x + 1,
For x = 0, y = 1, for x = 1, y = 3 and so on
For different values of x, we get the following table
| Inputx | Outputy |
|---|---|
| 0 | 1 |
| 1 | 3 |
| 2 | 5 |
| 3 | 7 |
| 4 | 9 |
Step 2:
Plotting these points we get this graph
Example 2
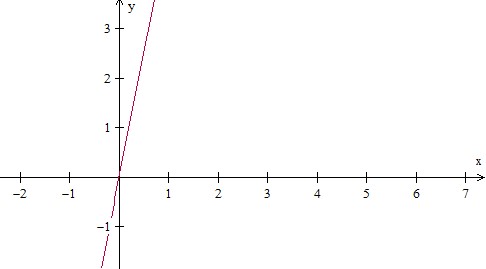
The relationship having unit rate is given by the equation: y = 5x. Make a table and plot 5 points.
Solution
Step 1:
In the equation y = 5x
For x = 0, y = 0, for x = 1, y = 5 and so on
For different values of x, we get the following table
| Inputx | Outputy |
|---|---|
| 0 | 0 |
| 1 | 5 |
| 2 | 10 |
| 3 | 15 |
| 4 | 20 |
Step 2:
Plotting these points we get this graph
Leave a Reply