Introduction
A function is a rule that takes in and works on an input and gives an output. It is usually represented as fx = y, where x is the input variable and y is the output variable.
By giving different whole number values to x, values of y can be found from the function rule. The x and y values are put in a table and then plotted as a graph.
Plotting a graph
So, from a function rule, x and y values can found and put in a table and also plotted as a graph.
Conversely, from a graph we can find x and y values and make a table of those values and find the function rule for the given graph also.
Example 1
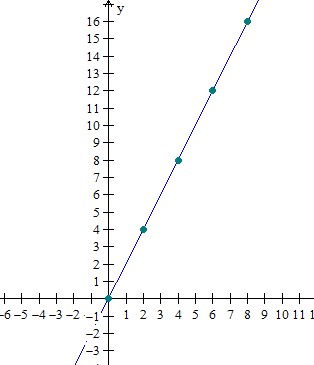
The table below describes a function. Graph this function.
| Inputx | Outputy |
|---|---|
| 0 | 0 |
| 2 | 4 |
| 4 | 8 |
| 6 | 12 |
| 8 | 16 |
Solution
Step 1:
From the table, we get the coordinates of the points as 0,0, 2,4, 4,8, 6,12, and 8,16
Step 2:
Making a plot of these points, we get
Example 2
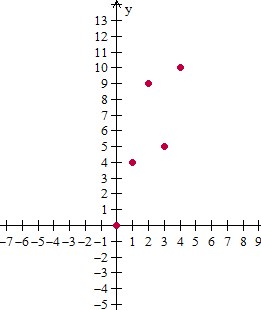
The graph of a function is given below. Fill in the table for this function.
Solution
Step 1:
From the graph plot, we get the coordinates of the points as 0,0, 1,4, 2,9, 3,5, and 4,10
Step 2:
Making a table of the x and y values, we get
| Inputx | Outputy |
|---|---|
| 0 | 0 |
| 1 | 4 |
| 2 | 9 |
| 3 | 5 |
| 4 | 10 |
Leave a Reply