Introduction
In this lesson, given a table of values, graphs are plotted from ordered pairs and equations are written.
Suppose we are given a table showing x and y values. The independent variable is represented by x and the dependent variable is represented by y and we have the ordered pairs of x,y.
- From the ordered pairs, a graph is plotted
- From the table of values, an equation is found giving the relation between x and y.
Example 1
Plot the ordered pairs described by the table. Write an equation relating x and y.
| Inputx | Outputy |
|---|---|
| 0 | 0 |
| 1 | 12 |
| 2 | 24 |
| 3 | 36 |
| 4 | 48 |
Solution
Step 1:
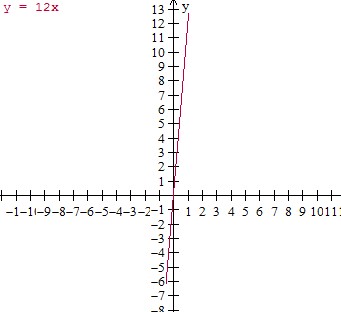
The equation of the ordered pairs of given table is
y = 12x
Step 2:
The plot of the ordered pairs of given table −
Example 2
Plot the ordered pairs described by the table. Write an equation relating x and y.
| Inputx | Outputy |
|---|---|
| 0 | 0.5 |
| 4 | 1.5 |
| 8 | 2.5 |
| 12 | 3.5 |
| 16 | 4.5 |
Solution
Step 1:
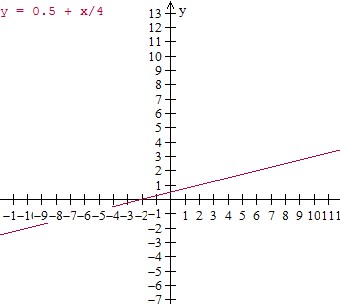
The equation of the ordered pairs of given table is
y = 0.5 + x4
Step 2:
The plot of the ordered pairs of given table −
Leave a Reply